
The retail industry took a 180-degree turn with the emergence of online shopping. With the speed and convenience of online retail, it has become easier for consumers to get what they want when they want it. Moreover, it allows many businesses to operate without the need for a physical store. However, the online shopping industry can be cutthroat. This is why understanding online shopping statistics is more important now than ever to get ahead of the competition.
In this article, we will be discussing and analyzing data ranging from the market size of online retail to its advantages and disadvantages, as well as changes that occurred because of Covid-19 and the possible impact of the pandemic on the market. We will even tackle the various technologies that businesses use such as the best shopping cart software to remain competitive in the online shopping industry. This way, you can have a better picture of how you can leverage this for your company.
To further help you in your online retail endeavors, you can also check out this guide to ecommerce software solutions. With this, hopefully, you can understand the kinds of tools you will need to reinforce your operations.

Online Shopping Statistics Table of Contents
General Online Shopping Statistics
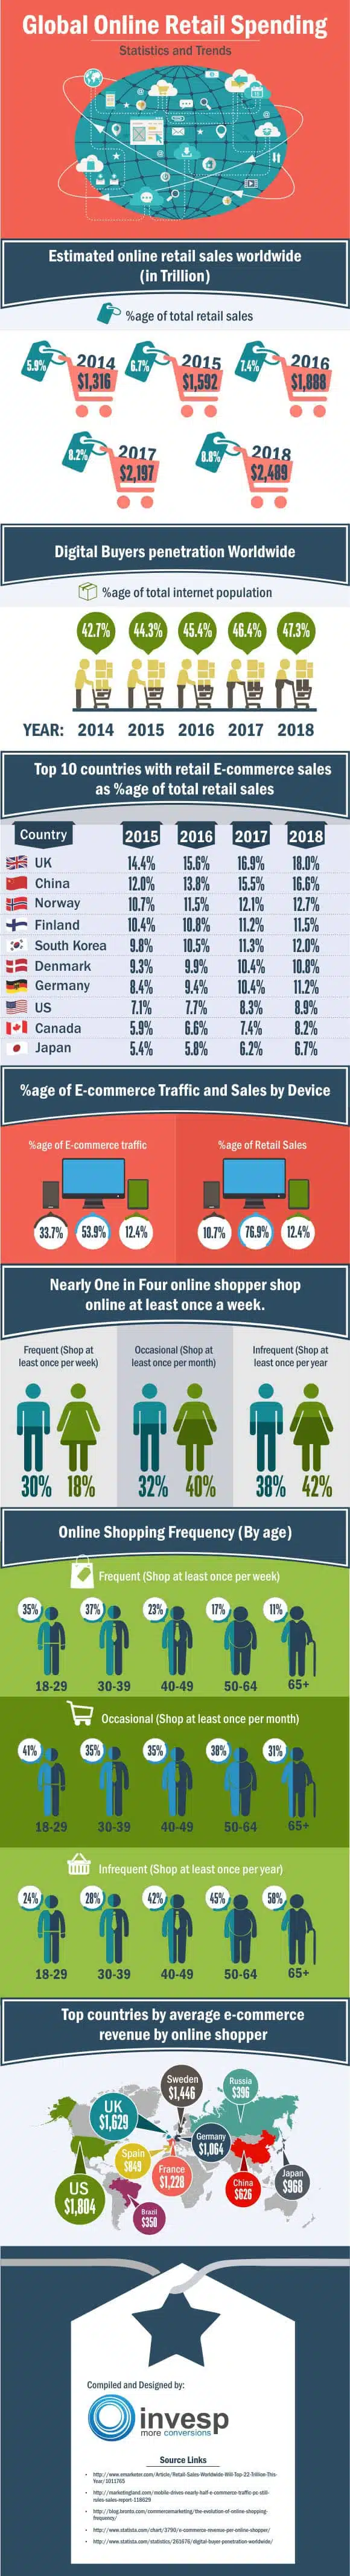
Online shopping market statistics reveal that businesses worldwide are engaging more and more of their customers through the internet. With each passing year, the numbers continue to grow in favor of these entrepreneurs. Below, you’ll see there’s an increasing number of digital buyers as well as higher revenues for online shopping in different countries. Moreover, average online store visits per user have become more frequent in the past few years.
- Ecommerce sales increased by 25% due to Covid-19. (BigCommerce, 2021)
- Because of that, global ecommerce revenue is anticipated to reach $2,723,991 million in 2021. (Statista, 2021)
- This coincides with the projection that the digital buyer penetration worldwide would go up by 65.2% in 2021. (eMarketer, 2017)
- For Q4 2020, US retail ecommerce sales hit an estimated $206.7 billion, a decrease of 1.2% from Q3 2020. (US Census, 2021)
- The Philippines, Malaysia, and Spain are among the nine countries that are expected to have a 20% growth in retail ecommerce sales in 2021. (eMarketer, 2021)
- Taobao is the most popular online marketplace worldwide in 2019 based on the gross merchandise value of $538 billion dollars. (Digital Commerce 360, 2021)
- By Q3 2020, third-party sellers had an average of 54% paid units sold on Amazon. (Amazon, 2020)
- Despite that, eBay came out as the most preferred online marketplace in 2020 of sellers with a rating of 6.53. (EcommerceBytes, 2020)
- With more sellers preferring eBay, the shares of the online marketplace went up 10% in extended trade. (Reuters, 2021)
- That resulted in an increase in annual active buyers on eBay by 7%, bringing the total global active buyers to 185 million. (Reuters, 2021)
- The total number of digital buyers in the US alone is 258.9 million. This figure is expected to rise to more than 307 million in 2023. (Statista, 2018)
- 69% of Americans have shopped online. (NPR, 2018)
- 25% of American adults shop online at least once every month. (NPR, 2018)
- 53% of US teens like to shop on Amazon. (Piper Sandler, 2020)
- 1 in every 4 online consumers purchases from online stores once a week. (Invesp, 2019)
The Impact of Online Shopping
Online shopping has reshaped the landscape of the retail industry. As you’ll see in the data we’ve compiled, customers have changed their behavior towards shopping. Moreso now that many shoppers are wary of going out due to the pandemic. They no longer go from store to store to inquire about a product. Nowadays, all they need to do is look up your products online, and by the time they visit your store, they’re ready to purchase with no questions asked.
This only shows how important it is to have an online store in this day and age. By having one at your disposal, you can have a channel through which potential customers can find out about your products without the need to physically visit your store. If you have yet to set up one for your business, you might want to consider using an online store builder or even sign up at an online marketplace.
- Customer satisfaction is affected mainly by the ease of checkout (81%), variety of goods and brands (80%), availability of multiple shipping options (73%), and the number of payment choices (71%). (Invesp, 2018)
- 80% of consumers are more likely to purchase a product if free shipping is available. Additionally, 64% are more willing to buy a product if the shop offers free returns and exchanges. (Invesp, 2018)
- 48% of Gen Xers and Millennials visit company websites or official online stores to research potential online purchases. (KPMG, 2017)
- 63% of consumers would go to an online marketplace for a first-time purchase because of better prices. (UPS, 2019)
What Online Shoppers Want
Shoppers will always have great expectations from the brands they are interested in, but how different are the expectations of online consumers? For starters, statistics show that convenience and personalized shopping experiences are crucial to customer loyalty in the online retail industry. By making transactions simpler and allowing them to find what they need, it is easier to secure conversions. In addition, it pays to provide perks such as free shipping options as well as return policies.
- People shop online because it lets them shop at any time (88%), find the product they are looking for quickly (88%), save time (84%), and get a better product selection (84%). In addition, there are those who simply didn’t want to line up at the store (78%) and believe that online stores have cheaper prices (76%). (NPR, 2018)
- 90% of online consumers are fine with waiting longer for a product if the vendor can offer free shipping. (NPR, 2018)
- 91% of consumers aged 18 to 34 trust online reviews as much as they value the opinions of family and friends. (Qualtrics, 2020)
- For 78% of online consumers, having product reviews on the e-store is important. (NPR, 2018)
- 39% of people who shop online say that a major influence in the purchasing decision is the availability of a free return policy. (NPR, 2018)
Why Do People Shop Online?
It lets them shop at any time: 88
It lets them shop at any time
%It lets them find the product they want quickly: 88
It lets them find the product they want quickly
%It lets them save time: 84
It lets them save time
%It gives them a better product selection: 84
It gives them a better product selection
%It doesn't require them to line up at the store: 78
It doesn't require them to line up at the store
%It gives them better prices: 76
It gives them better prices
%Source: National Public Radio
Designed byThe Effects of Covid-19 on eCommerce
The pandemic forced closures of restaurants, grocery stores, and other shops. Restrictions also meant that people had to stay indoors and minimize physical contact with others as much as possible. Because of that, they had to turn to online stores to purchase necessities and other goods.
- 37% of consumers expected to spend more on goods from online marketplaces because of Covid-19. (Morning Consult, 2020)
- 31% of customers deliberately shifted to buying foods from restaurants online. (Statista, 2020)
- Only 9% of consumers in the US experienced buying online for the first time because of the pandemic. Meanwhile, 59% said they had already done so pre-pandemic. (Morning Consult, 2020)
- One-third of men said that the pandemic affected how much they spent on products, compared to 25% of women. (BigCommerce, 2021)
- The number of face-mask sellers on Etsy grew 5x in the span of two weeks as demand for the product went up. (BigCommerce, 2021)
Online Shopping by Industry Statistics
The online shopping culture may be in full throttle, but this doesn’t mean people are buying everything under the sun via the internet. Statistics suggest that online shoppers are quite picky as to what kinds of products they buy online.
Surprisingly fashion is one of the industries that seem to be thriving online. This is despite shoppers not being able to fit the products before purchase. In addition, more and more people worldwide are opting to have groceries delivered.
- Globally, the projections for the top online shopping categories are fashion ($759.5 billion), toys, hobby, and DIY ($590.7 billion), electronics and media ($542.4 billion), food and personal care ($468.5 billion), and furniture and appliances ($362.9 billion). (Oberlo, 2021)
- In the US, the predictions for the top online shopping categories are fashion ($142.8 billion), electronics and media ($100.1 billion), toys, hobby, and DIY ($93.3 billion), furniture and appliances ($76.6 billion), food and personal care ($56.4 billion). (Oberlo, 2021)
- In the Asia Pacific, the most popular online industries are packed groceries (40%), home care (37%), fresh groceries (35%), and video gaming (30%). (Nielsen, 2018)
- 60% of consumers prefer purchasing books, music, movies, and video games online than in-store. (PwC, 2017)
- 30% of computer and electronics sales worldwide come from online purchases. (The Atlantic, 2019)
- Customers who bought over-the-counter medicine online grew by 36%. (McKinsey & Company, 2020)
- Online purchases of household supplies grew by 24% due to Covid-19. (McKinsey & Company, 2020)
- Retail ecommerce revenue is projected to reach $124 billion in 2021. (Statista, 2021)
Online Fashion Shopping
- The global fashion ecommerce market is forecast to reach $759,466 million in 2025. (Statista, 2021)
- The number of consumers in the apparel segment is predicted to reach 3,750.5 million by 2025. (Statista, 2020)
- 58% of US adults have bought apparel online. (NPR, 2018)
Online Grocery Shopping
- The online retail grocery industry is expected to grow the most in Asia. By 2021, it is anticipated to reach $4,084 billion. (Ocado, 2017)
- Experts predict that only 2.6% of grocery revenue will come from online sales. (Statista, 2021)
- 20% of shoppers residing in South Korea now buy their groceries online. (The Atlantic, 2019)
- Grocery ecommerce soared to nearly 250% after the second week of March 2020 because of the pandemic. (BigCommerce, 2020)

Mobile Shopping Statistics
When was the last time you spent a whole day without checking your phone? There’s a good chance you haven’t done that since you purchased it, and the same could be said about your customers.
Nowadays, a phone’s use goes beyond calling and texting. With internet access and the various mobile applications available today, your phone can perform the various functions of a computer. In other words, people will be able to shop on-the-go sans the need for a desktop.
So, while mobile commerce is still not as popular as traditional online shopping, it might be important for you to optimize your store for mobile transactions. This way, you can expand your market and maximize sales.
- 1 out of 5 US adults access the internet exclusively through smartphones. (Pew Research Center, 2019)
- Retail mCommerce sales are predicted to hit $432.4 billion in 2022. (eMarketer, 2019)
- The mobile online shopping market share is forecast to make up 67.2% of digital sales in 2019. Furthermore, it is expected to grow to 72.9% by 2021. (eMarketer, 2018)
- The spending per user on mobile ecommerce will increase by up to 228% before 2021. (eMarketer, 2018)
- 64% of ecommerce traffic was generated using mobile phones in the first quarter of 2019. (Salesforce, 2021)
- Smartphones account for 61% of online store visits globally. Meanwhile, desktop devices only account for 30%. (DataReportal, 2021)
- Only 45% of online retail sales came from mobile shopping. 61% are made using desktop devices. (DataReportal, 2021)
- Install-to-register coupon and reward apps had a 60.4% user acquisition rate as of April 2020. (Adjust, 2020)
- Mobile ecommerce spending in the US in Q1 2020 was $52.1 billion. In Q2 2020, that amount went down to $47.8 billion. (Comscore, 2020)
- Of all retail ecommerce sales in Q2 2020, 31% was mobile. (Comscore, 2020)
- Overall global sales on mobile may go down by 5%. (BigCommerce, 2020)

Social Shopping Statistics
Practically everyone is on social media, be they individuals, celebrities, politicians, or organizations. So, it’s safe to say that it’s one of the best places to showcase and sell your products. However, not all social media networks are created equal. In the data provided, you will see that some are simply better for social shopping than others, so it is best to be careful about which platforms you will be utilizing for your social shopping campaigns.
- 87% of online shoppers say that social media is an important factor when it comes to purchasing decisions. (Adweek, 2018)
- When it comes to social shopping, China rules. Tencent’s WeChat delivered $115 billion in revenue from social commerce alone. (The Drum, 2021)
- In comparison, only 6% of UK customers have made a purchase on a social platform. (The Drum, 2021)
- 45% of shoppers prefer to shop on Instagram while 41% would choose Facebook. (The Drum, 2021)
- Pinterest has the highest average order value at $154. It is closely followed by Instagram at $103, Facebook at $69, and Snapchat at $57. (MobileMarketing, 2019)
- 85% of social media purchases are from Facebook. (Shopify, 2018)
- Almost 25% of modern businesses give their shoppers the option to purchase via Facebook. (Forbes, 2018)
Making the Most Out of Social Commerce
Looking to make sure that your social shopping campaigns are driving sales? You can start by focusing on platforms that your target audience is most likely to use for social shopping. Facebook, Instagram, and Pinterest are only three of the many options you can choose from.
After this, try to study the various features that these platforms offer to online businesses. For instance, Facebook has a marketplace feature that will allow you to sell directly on the platform. Meanwhile, Instagram lets you create shoppable posts so that consumers no longer have to be redirected several times to get to the checkout page.
Lastly, as you’ll see below, it’s important to learn what customers want to see on your social shopping site such as customer reviews and product videos. These will allow them to better assess what you have to offer without having to research extensively on their own.
- According to 30% of online shoppers, they would purchase from brands through Instagram, Twitter, Pinterest, or Snapchat. (Forbes, 2018)
- 41% of vendors selling on Instagram utilize the shoppable posts feature as it makes transactions more instantaneous for shoppers. (Shopify, 2018)
- 23% of people say that reviews and recommendations that they see on social media play a role in their shopping decisions. (Forbes, 2018)
- 74% of people believe that watching videos on social media and purchasing something online has a direct correlation. (Adweek, 2018)
Source: Socialnomics
Shopping Cart Abandonment Statistics
Just as shoppers can walk into your store and change their minds about purchasing, online consumers can simply abandon their online shopping carts. You might be thinking that this is completely fine and that there are plenty of other people out there who would purchase from your store, but statistics say otherwise.
- 69.57% of online orders were abandoned in 2019. This is the highest shopping cart abandonment rate since 2014 (68.07%). (Baymard Institute, 2020)
- 49% of consumers abandon their carts due to high extra costs. (Baymard Institute, 2020)
- Cart abandonment can take up to $18 billion in sales every year. (Small Business Trends, 2021)
Countering Cart Abandonment
So, your customer has abandoned his cart, now what? According to several online shopping reports, there are many ways through which you can counter cart abandonment. A good lead would be finding out why they aren’t pushing through with their purchases so you can address the issues quickly.
Secondly, it is important that you optimize your checkout interface. By simply making the process faster and simpler as well as giving them ample payment options, you can easily keep shoppers from choosing a different store.
Most importantly, with the rising popularity of personalized ecommerce, making use of retargeted ads might do you well. This will allow you to generate product recommendations that are tailored to the browsing behavior of each website visitor, which can boost the chances of conversion.
- Digital shoppers abandon their carts because of high shipping costs (63%), faulty discount codes (46%), and long shipping time (36%). In addition, there are those who abandon carts when they are asked to re-enter their credit card details (30%) or their shipping information (25%). (Forter, 2019)
- Online consumers get turned off by poor checkout user interface. Statistics reveal that they will abandon their cart if the site asks them to create an account (34%), the checkout process is lengthy (26%), the total order cost is not calculated (21%), or there are not enough payment methods (6%). (Baymard Institute, 2020)
- Businesses can recover up to $260 billion in revenue by simply optimizing checkout processes. (Baymard Institute, 2020)
- Follow-up emails concerning abandoned carts have an open rate of 45%. (MailChimp, 2017)
- Shoppers who see retargeted ads on your online shop are 70% more likely to get converted. (ReadyCloud Suite, 2018)
Top Reasons for Shopping Cart Abandonment
The shipping cost is too high: 63
The shipping cost is too high
%The discount code isn't working: 46
The discount code isn't working
%The delivery will take too long: 36
The delivery will take too long
%They were asked to re-enter credit card details: 30
They were asked to re-enter credit card details
%They were asked to re-enter shipping information: 25
They were asked to re-enter shipping information
%Source: Statista
Designed byMost Popular Shopping Cart Software
- Wix is a comprehensive e-commerce solution that gives you total freedom in creating your online store. Aside from providing you with customizing tools for your storefront and shopping cart, it also supports secure payment solutions.
- X-cart is an open-source shopping cart platform with robust ecommerce tools to grow your online store. It handles small to large product catalogs perfect for businesses of all sizes.
- Bigcommerce is an industry-leading and versatile ecommerce solution designed to streamline your storefront operations. It supports digital wallets including Apple Pay, Amazon Pay, PayPal One Touch and more.
- Shopify combines ecommerce and point-of-sale features in a single platform. It provides you with a comprehensive dashboard where you can manage orders, shipping, and payments.
- ShopifyPlus is an ecommerce platform for high-volume businesses. It simplifies multi-channel selling with a unified back-office and accelerated and customizable checkout features.
Technology and Online Shopping Statistics
Online retail and technology go hand-in-hand. So, this could only mean that online shopping experiences should evolve as technology does.
Studies suggest that more businesses are using artificial intelligence (AI) to accommodate clients and understand customer behavior. Meanwhile, there are those that utilize drones for faster deliveries. On the other hand, more consumers are using voice assistants for transactions.
With this said, if you want to stand out in the online shopping industry, you not only need to offer the best products. It’s a must that you improve the entire shopping experience using technology.
- By 2021, 85% of interactions with customers will be handled without human agents. (Smallbizgenius, 2020)
- Using AI can boost average order values by 26%. (Salesforce, 2019)
- 32% of voice assistant users have utilized their smart speakers for product research. Meanwhile, 32% use them to compare product prices. (Adweek, 2018)
- 25% of people who use voice assistants utilize smart speakers for one-time delivery purchases. Meanwhile, 21% have used it to repurchase things they buy on a regular basis. (Adweek, 2018)
- 10% of consumers that use Alexa have tried voice shopping several times. (Forbes, 2018)

Online Shopping Challenges Statistics
Online shopping has plenty of benefits to offer. However, there are some limitations as to the conveniences it can provide. For instance, you can’t touch the products through the screen, and there’s no telling whether the item will look exactly as it did on the website. There’s also the problem with shipping costs. As a result, many consumers still prefer the good old’ visit to the store.
In addition to the statistics below, you might also want to check out this list of ecommerce challenges. This way, you can prepare for any obstacle that you might encounter while launching your online store.
- An online shopping report revealed that 56% of consumers still prefer the in-store shopping experience over digital shopping. (NPR, 2018)
- Consumers would still purchase most products in-store than online. (PwC, 2017)
- Despite the rising number of online shoppers, only 2.86% of website visits get converted. (Monetate, 2019)
- Consumers prefer brick-and-mortar stores because they want to see the item first (56%), try on the item (55%), and check if the product looks different (41%). On the other hand, there are those that are concerned with long delivery times (34%), high shipping costs (25%), and the fragility of the item (24%). (KPMG, 2017)
Webstore Management Challenges
Online shopping data suggests that simply having a web store is not enough to draw consumers in. If you truly want to capitalize on digital retail, you will have to pay special attention to how you build and maintain your website.
As we’ve tackled earlier, speed and convenience are two of the top reasons why people shop online in the first place. So, for starters, it is pertinent that you optimize the loading times of your site and make it as mobile-friendly as possible. This way, potential customers access your catalog as quickly and easily as possible.
- The average time online consumers stay on estores dropped to only 4 minutes and 12 seconds. (Salesforce, 2019)
- 40% would abandon websites that would take 3 or more seconds to load. (Forbes, 2018)
- 47% of online shoppers expect webpages to load in less than 2 seconds. (KISSmetrics, 2011)
- 79% of shoppers that experience issues with web performance are less likely to get converted. (KISSmetrics, 2011)
- 52% of people say that the speed at which a website loads is crucial for customer loyalty. (KISSmetrics, 2011)
- A one-second delay on your webpage can decrease customer satisfaction by 16%. Consequently, it results in a 7% reduction in conversions. (KISSmetrics, 2011)
- Users that didn’t have a pleasant mobile browsing experience are 62% less likely to purchase from the brand. (Think With Google, 2018)

What Do These Online Shopping Facts Mean for Your Business?
There’s nothing quite like purchasing items from the comfort of your own home. With just a click of a button, you can purchase products and have them delivered straight to your doorstep. After all, not everybody has the flexibility to include a trip to the mall in their daily routine. That said, it’s not surprising that the online retail industry is flourishing.
The question now would be, is it necessary for you to have an online store of your own? Well, it’s a yes and a no.
As you have read from our compilation of statistics, brick-and-mortar stores still have an advantage over online sellers. There are many consumers who prefer the experience of browsing in a shop. This is because it allows them to assess the items they want in the flesh. However, that is not to say that investing in online shopping won’t benefit you.
Giving your consumers the option to check out what your store has to offer online can expand your reach and boost customer loyalty. Furthermore, online shopping is what can help you bridge the gap between your business, and consumers want to browse products without having to interact with sales personnel.
To sum up, we hope that this compilation of online shopping statistics gave you a better idea of the changes in the industry. This way, it is easier to plan how you can keep up with competitors in the coming years. If you are looking to explore this option for your company, there are plenty of ecommerce software for small business and large companies to choose from. Just be sure to choose the one that is most compatible with your business model and can offer you functionalities that can easily adapt to your existing workflows.
References:
- 2by2host (2019, April 17). Pinterest and Instagram drive highest average order value on social media. MobileMarketing
- Abbamonte, K. (2018, July 25). Social Commerce For Retail: What Is It and 3 Examples of Retailers Doing it Well. Shopify
- Adjust (2020). Shopping Apps in 2020: The latest UA Trends & Benchmarks. Adjust
- Adweek (2018, August 2). Will Social Media and Ecommerce Ever Really Get Together? Adweek
- Alcantara, A. (2018, September 10). A New Adobe Study Reveals How Consumers Are Actually Using Voice to Shop. Adweek
- Amazon (2020, October 29). AMAZON.COM ANNOUNCES THIRD QUARTER RESULTS. Amazon
- Arnold, A. (2018, April 4). Are We Entering The Era Of Social Shopping? Forbes
- Baymard Institute (2020, December 20). 44 Cart Abandonment Rate Statistics. Baymard Institute
- Comscore (2020, October). 2020 REPORT PREVIEW State of Online Retail. Comscore
- Cramer-Flood, E. (2020, June 22). Global Ecommerce 2020. eMarketer
- DataReportal (2021, January). ALL THE NUMBERS YOU NEED. DataReportal
- Dennis, S. (2018, August 10). Sorry, Alexa: Voice Shopping Is Mainly Hype — For Now. Forbes
- Digital Commerce 360 (2021, March 9). What are the top online marketplaces? Digital Commerce 360
- Diorio, J. (2018, March). A few tips to speed up your mobile site and tools to test it. Think with Google
- Droesch, B. (2019, April 4). Smartphones Will Account for More than One-Third of Ecommerce Sales in 2019. eMarketer
- eMarketer (2017, July). Digital buyer penetration worldwide from 2016 to 2021. eMarketer
- eMarketer (2018, January 29). Worldwide Retail and Ecommerce Sales: eMarketer’s Updated Forecast and New Mcommerce Estimates for 2016—2021. eMarketer
- Forter (2019, February 20). Friction-Filled Online Checkouts Cause Shopping Cart. Forter
- Invesp (2019). Global Online Retail Spending. Invesp
- Jovic, D. (2020, November 20). The Future is Now – 37 Fascinating Chatbot Statistics. Smallbizgenius
- Kaemingk, D. (2020, October 30). Online reviews statistics to know in 2021. Qualtrics
- KISSmetrics (2011, April). How Loading Time Affects Your Bottom Line. KISSmetrics
- KPMG (2017). 2017 Global Online Consumer Report. KPMG
- Lazar, M. (2018, April 12). THESE 2018 RETARGETING STATISTICS PROVE IT WORKS. ReadyCloud Suite
- Mailchimp (2017, May 5). Email Marketing Benchmarks and Statistics by Industry. Mailchimp
- McKinsey & Company (2020, December 8). McKinsey Survey: US consumer sentiment during the coronavirus crisis. McKinsey & Company
- Meyer, S. (2021, March 5). COVID-19 Infographic: How Ecommerce Is Being Impacted. BigCommerce
- Meyer, S. (2021, March 5). Understanding the COVID-19 Effect on Online Shopping Behavior. BigCommerce
- Monetate (2019). All-New Ecommerce Benchmarks for Q2 2019. Monetate
- Morning Consult (2020, March). National Tracking Poll #200394 March 24-26, 2020. Morning Consult
- Morning Consult (2020, March). Share of consumers in the United States have bought something online for the first time over the past few weeks due to social distancing during the coronavirus pandemic as of March 26, 2020. Morning Consult
- Nielsen (2018, November). CONNECTED COMMERCE. Nielsen
- NPR (2018, June 6). NPR/Marist Poll: Amazon is a colossus in a nation of shoppers. NPR
- Oberlo (2021, January). TOP ONLINE SHOPPING CATEGORIES. Oberlo
- Ocado (2017, February). Sales value of grocery retail worldwide in 2016 and 2021, by region. Ocado
- Pew Research Center (2019, June 5). Mobile Fact Sheet. Pew Research Center
- Pilon, A. (2021, March 14). Video Drives More Ecommerce Conversions than Social Media (Infographic). Small Business Trends
- Piper Sandler (2020). A collaborative consumer insights project. Piper Sandler
- PwC (2017). Total Retail 2017. PwC
- Ramachandran, M. (2018, June 22). The Evolution of Social Shopping in the Ecommerce Landscape. Adweek
- Rana, A. & Dastin, J. (2021, February 4). Ebay earnings beat on pandemic-driven surge in online shopping; shares soar. Reuters
- Saleh, K. (2018, April 11). Online Consumer Shopping Habits and Behavior. Invesp
- Salesforce (2021, March 17). The Shopping Index. Salesforce
- Semuals, A. (2019, February 6). Why People Still Don’t Buy Groceries Online. The Atlantic
- Statista (2020). COVID-19 Barometer 2020. Statista
- Statista (2021). eCommerce Worldwide. Statista
- Statista (2021). Fashion United States. Statista
- Statista (2021). Fashion Worldwide. Statista
- Statista (2021). Food & Beverages Worldwide. Statista
- Steiner, I. (2020, February 15). Sellers Choice Awards 2020: Merchants Rate Top Online Marketplaces. EcommerceBytes
- Tilley, J. (2021, January 4). Social commerce: transforming the online shopping experience. The Drum
- Tripura, K. (2018, November 2). Four E-Commerce SEO Trends To Prepare For In 2019. Forbes
- UPS (2019). UPS Pulse of the Online Shopper™ Report. UPS
- US Census (2021, February 19). QUARTERLY RETAIL E-COMMERCE SALES 4TH QUARTER 2020. US Census
- We Are Social (2018, October). Share of internet users who have purchased selected products online in the past 12 months as of 2018. We Are Social


Leave a comment!